New Amsterdam Invest N.V. lists on Euronext Amsterdam through de-SPAC
Mon courtier énergie group lists on Euronext Growth Paris
Euronext Artificial Intelligence World Index
The thematic index dedicated to the artificial intelligence industry.
Why invest in artificial intelligence?
Artificial Intelligence (AI) technologies have brought tremendous change to processes in everyday life. Many tasks have become automated or are at least assisted by advanced algorithms. Globally, the race to AI is accelerating exponentially.
In Europe, the AI landscape is also in the process of significant evolution. AI-enabled algorithms have been adopted widely, creating increased risks for the safeguarding of data and human rights.
In response, the European Commission has proposed an AI Act, the first of its kind globally, to establish a legal operational framework for all AI deployments with critical impact and to ensure that AI development is human-centric and ethical. The EU’s approach to AI aims to give users the confidence to embrace these technologies while encouraging businesses to develop them.
As a leading index provider in Europe, Euronext’s ambition is to connect European economies to global capital markets, to accelerate innovation and sustainable growth.
Key Principles of the Euronext AI World Index
The Euronext® Artificial Intelligence World Index supports the growing demand for innovative thematic investment solutions by providing exposure to companies active in the field of AI.
The AI World Index tracks the 100 highest ranking companies that are active in the following products or services: Artificial intelligence, Speech recognition, Computer vision, Computer linguistic, Machine learning, Computer audition, Robotics, Discovery, Planning, Creation.
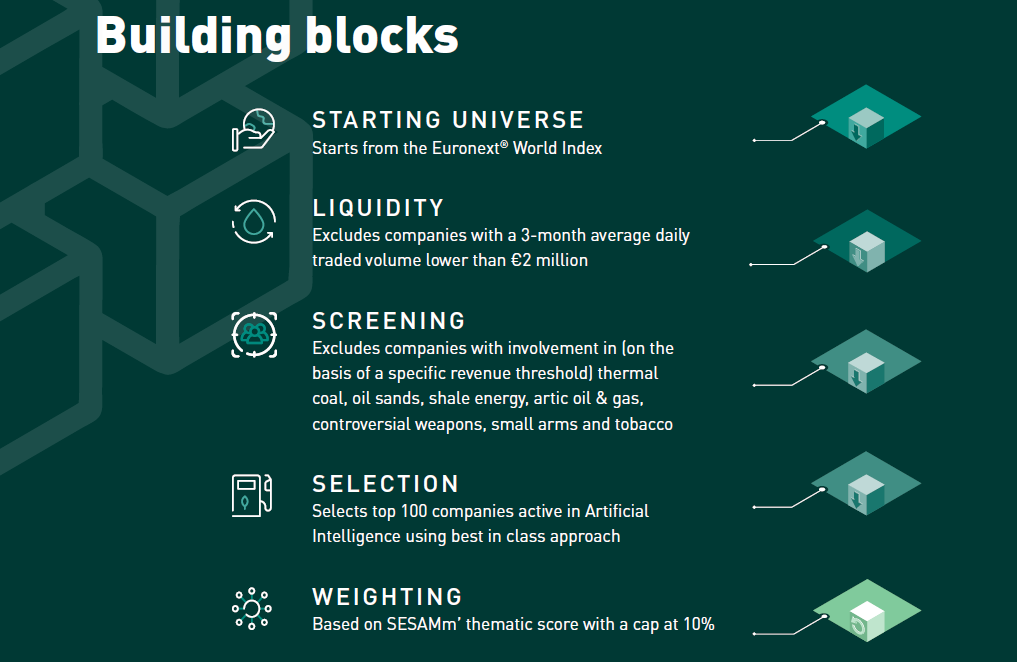
The Companies are identified by SESAMm
The index selects companies based on their exposure and sentiment scores assessed by SESAMm through a granular analysis of public information available on the web.
SESAMm is a leading artificial intelligence and NLP technology company which leverages analysis of over 20 billion documents to produce valuable insights and indicators that improve investment decision-making across various asset classes (equity, fixed-income, alternatives, crypto) and themes (thematic investing).
The Euronext® AI World Index provides opportunities for the creation of a wide range of investment vehicles, such as ETFs, funds and structured products.
Learn more about Euronext Artificial Intelligence Index:
Euronext AI world Index Live Quotes
Euronext AI World Index Rules | Euronext AI World Index Factsheet
Euronext AI World Index ESG Report
Discover more Euronext thematic Indices
Watch the presentation:
Contact us at index-team@euronext.com for any queries.
Back to previous page | Euronext Index Data Page | Euronext Index Team Services
VBBO Trading: A best execution solution for retail investors or for market makers?
Pages: 18
Publication: 10 July 2020
Authors: Paul Besson, Head of Quantitative Research and Théo Compérot, Quant Research Analyst
VBBO Trading: a best execution solution for retail investors or for market makers?
On average there is an overall negative price improvement of −0.5 bps for VBBO trading vs EBBO. These deteriorations worsen with wider spread and larger trade sizes (see Table 2, p7)
- We observe a strong negative relationship between the trade size and the price improvement of Volume Weighted Best Bid and Offer (VBBO) trades. The larger the trade size, the more negative the price improvement (see Figure 7, p9). For example, the average improvement for a €2,500 trade is −0.4 bps, while it is −1.0 bp for a €7,500 trade.
- Likewise, we also observe a strong negative relationship between price improvement and average spread size (measured at the time of the trade). Thus, for a 5 bps spread we observe a −0.3 bps price improvement, while for an 18 bps spread we observe a −1.0 bp price improvement versus European Best Bid and Offer (EBBO) (see Figure 9, p10).
VBBO seems to be a better best execution solution for market makers than for retail investors
-
We show that the worsening of execution price versus EBBO (+0.5 bp on average) is mostly attributable to the cases where the second best limit price contributes to the VBBO. Enabling trading at a reference price including a second limit computation, when the first limit is still valid (see Figure 18, p15), provides a unique opportunity to the market maker to sell at a higher price than the available best ask (+4.1 bps), even 100 milliseconds after the trade took place.
-
Overall, buying at EBBO +0.5 bps should not necessarily be considered as a proof of best execution for a retail order. This net reference is achieved by most compliant institutional investors. As evidenced by the improved quotes versus EBBO offered by market makers to retail investors, an execution price that is better than standard EBBO should be expected to demonstrate best execution for these highly prized flows.
-
More fundamentally, any kind of reference price system that does not allow market makers to compete on prices, thus prevents retail investors from benefitting from the price improvements these uninformed flows are entitled to receive. Therefore a central order book model with improved quotes for retail flows seems the most natural design to transparently pass on price improvements to retail investors.
Purpose
In this study we aim to compare Equiduct VBBO trades with the corresponding EBBO quotes to assess the performance of these types of trading. Performance of VBBO trading will be measured by the relative difference between executed prices and their corresponding EBBO reference prices. We have therefore reviewed all VBBO trades from Equiduct from December 2019 to February 2020. This corresponds to 1.16 million individual retail trades.
EBBO computations were provided by QuantHouse, the leader in high frequency data, chosen for its strong real-time data expertise.
We will focus on 4 main objectives:
- Compare prices for VBBO trades with EBBO prices to determine the price improvement or price deterioration observed in these trades;
- Study how this relative performance behaves with the corresponding underlying trade sizes and the bid-ask spreads of stocks;
- Explain the Equiduct VBBO trading performance by considering independently those trades with sizes available on the EBBO first limits, and larger trades with sizes that were not available on the EBBO first limits;
- Consider the question of best execution for VBBO trading.
BoB versus Apex: No free lunch - trading on Apex more costly than on Best of Book
Pages: 20
Publication: 13 October 2020
Authors: Paul Besson, Head of Quantitative Research and Théo Compérot, Quant Research Analyst
BoB versus Apex
No free lunch - trading on Apex more costly than on Best of Book
Complementing our first paper on VBBO Trading (July 2020), we analysed the overall costs of trading on Equiduct’s Apex vs on Euronext’s Best of Book (BoB):
- We have considered all Apex and BoB trades from December 2019 to April 2020 on the same stock universe with similar characteristics, thus regrouping 2.3 million trades on Equiduct and 3.6 million Euronext trades. We then computed the net price improvement on each of these trades using QuantHouse European Best Bid Offer computed at the same microsecond.
- Overall, we found that BoB improvements, net of fees, are outperforming Apex improvements by +1.36 bps using simple averages, and by +2.47 bps when using turnover weighted averages. This clearly demonstrates that the Euronext BoB model outperforms the Equiduct Apex zero fee model (see Figure 7).
- As Apex’s reference price model does not enable market makers to improve prices, as is the case for BoB, relative net improvement of BoB versus Apex strongly increases as spreads widen. On spreads larger than 10 bps, BoB’s improved quotes outperform the EBBO in 40% of cases (see Figure 12).
Pasquarelli Auto S.p.A. lists on Euronext Growth Milan
Euronext appoints Roberto Pecora as CEO of Euronext Clearing

Towards T+1 and Ehanching Efficiency
Towards T+1 and Ehanching Efficiency
22/05/2024
As the US market gears up for the transition to T+1 settlement cycles, Europe is also weighing t
- Conference
- Italy
Better passive posting across Lit venues based on quantitative analysis of Markouts
Pages: 40
Publication: 17 February 2022
Authors: Paul Besson, Head of Quantitative Research, Théo Compérot, Quant Research Analyst and Victor Vialard, Quant Research Analyst
Price reversion has become an essential topic for traders seeking to improve their allocation across venues. In this paper, based on public market data from primary markets and MTFs and using 0.8 million trades, we address specifically three key questions related to Markouts and venue selection for the benefit of investors.
We first evidence that Markouts increase almost linearly with spreads, and that their main driver is the aggressive trade size expressed as a proportion of the available consolidated liquidity (see Figure 8 p11).
Then, we exhibit that Markouts +1s after an aggressive buy trade at the European Best Offer are +0.4 bps larger for Turquoise and +0.6 bps larger for Cboe Europe compared to Euronext (see Figure 21 p22).
Lastly we show in the same manner that Markouts +100s after an aggressive buy trade at the European Best Offer are +0.4 bps larger for Turquoise and +0.8 bps larger for Cboe Europe compared to Euronext (see Figure 24 p24).
We believe that, for the benefit of investors, better Markouts on Euronext should be reflected in overall passive trade allocations.
Price Markouts and venue selection
Venues and Markout analysis
The analysis of price changes occurring before and after elementary executions on venues is often referred to as “price reversion” or “Markouts” analysis. When assessing the characteristics of both Dark and Lit venues, these metrics have become essential to help participants improve their trading outcomes through a reliable method of venue selection.
Many public studies are available on EBBO presence and the available depth across European trading venues. Nevertheless, there is surprisingly little or no publicly available assessment of trade Markout analysis across European venues in the academic literature.
Best execution and venue selection for aggressive and passive trades
Venue selection for investors’ trades is both a crucial and complex topic. While the ultimate choice of venue results from the executing brokers’ own order-routing logic, investors’ trading performance depends on this key choice. Venue selection covers two distinct situations that must be differentiated between: aggressive and passive trading.
Venue selection in the context of aggressive trading is strictly controlled by best execution practices which require that aggressive trades are routed first to venues that display the required quantity at best price. Therefore, differences in venue selection exist, but they only come into play when several venues display similar liquidity at the same price.
In contrast, venue selection in the context of passive trading is open to more interpretation. Some investors seem to believe that across similar types of venue, sending a passive limit order should lead to the same outcome, as the execution price remains the same in all cases. Thus some may think that the choice of venue for passive trades is only a secondary matter. Our main objective in this paper is to evidence that different passive trading allocations lead to different outcomes.
Main questions addressed on Markouts across Lit venues
In this note we focus on multilateral Lit venues. We first evidence the properties of Markouts following a trade. We then show the main drivers of Markouts. Then we compare Markouts across the main continental Lit venues: Euronext, Cboe Europe and Turquoise. Finally, we show significant differences in outcomes and relate these findings to passive posting strategies across exchanges.