


Earlier this year, we discussed how understanding data and insights can help financial institutions capitalize on and address changing investor behaviour and market trends. In this article, we look at a very specific trend, namely the marked increase in Danish private investing during the pandemic, and how VP Securities Data Services business area can help shed light on what’s driving this trend.
A counter-intuitive market reaction
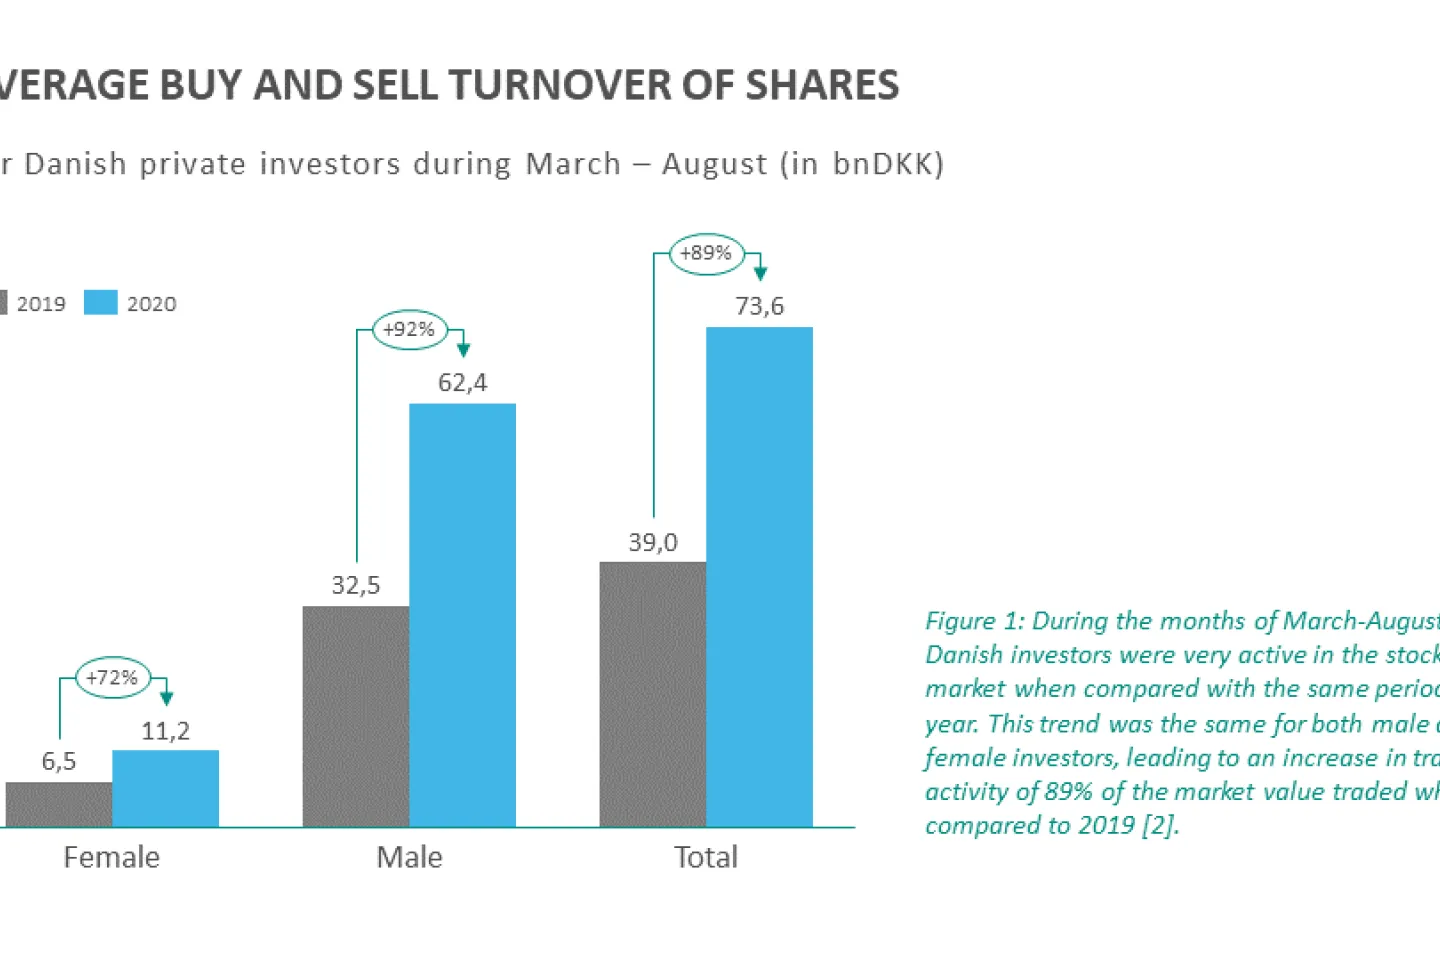
The financial markets don’t always react as we think they should. During the past six months, the world has faced a global pandemic, which has closed businesses, borders and countries on practically every continent. Daily news has been filled with images of empty airports, financial districts and shopping malls. Countries’ GDPs have fallen and many economies are on the edge of a recession, the likes of which hasn’t been seen in over a decade. And yet, in the midst of all of this economic gloom, the stock market has enjoyed a period of absolute prosperity. In March, the month that many countries shutdown in order to stop the spread of COVID-19, there was a 163% increase in Danish private investor trading[1] in comparison with 2019 levels. From March to August, the monthly average trading activity has increased by 89%, when compared to the 2019 full-year average.
VP’s Data Services decided to take a closer look at the data behind this trend. They wanted to find out:
- What’s the nature of the increased trading activity, i.e. are Danish private investors buying more, selling more or both?
- Which industries are driving this trend for private investors, i.e. what are Danish private investors buying and selling?
- How does the increased trading activity break down across gender?
Increased activity driven by buying … and selling
“If we look at the period from March to August 2020, we can see that there has been a shift in overall market activity amongst Danish private investors. In the months of March and April, trading activity was driven primarily by share purchases, whereas from May to July, it was driven by share sales,” comments Nino Ziino, Data Scientist, Issuer Products at VP.
Utilities a sought-after portfolio addition
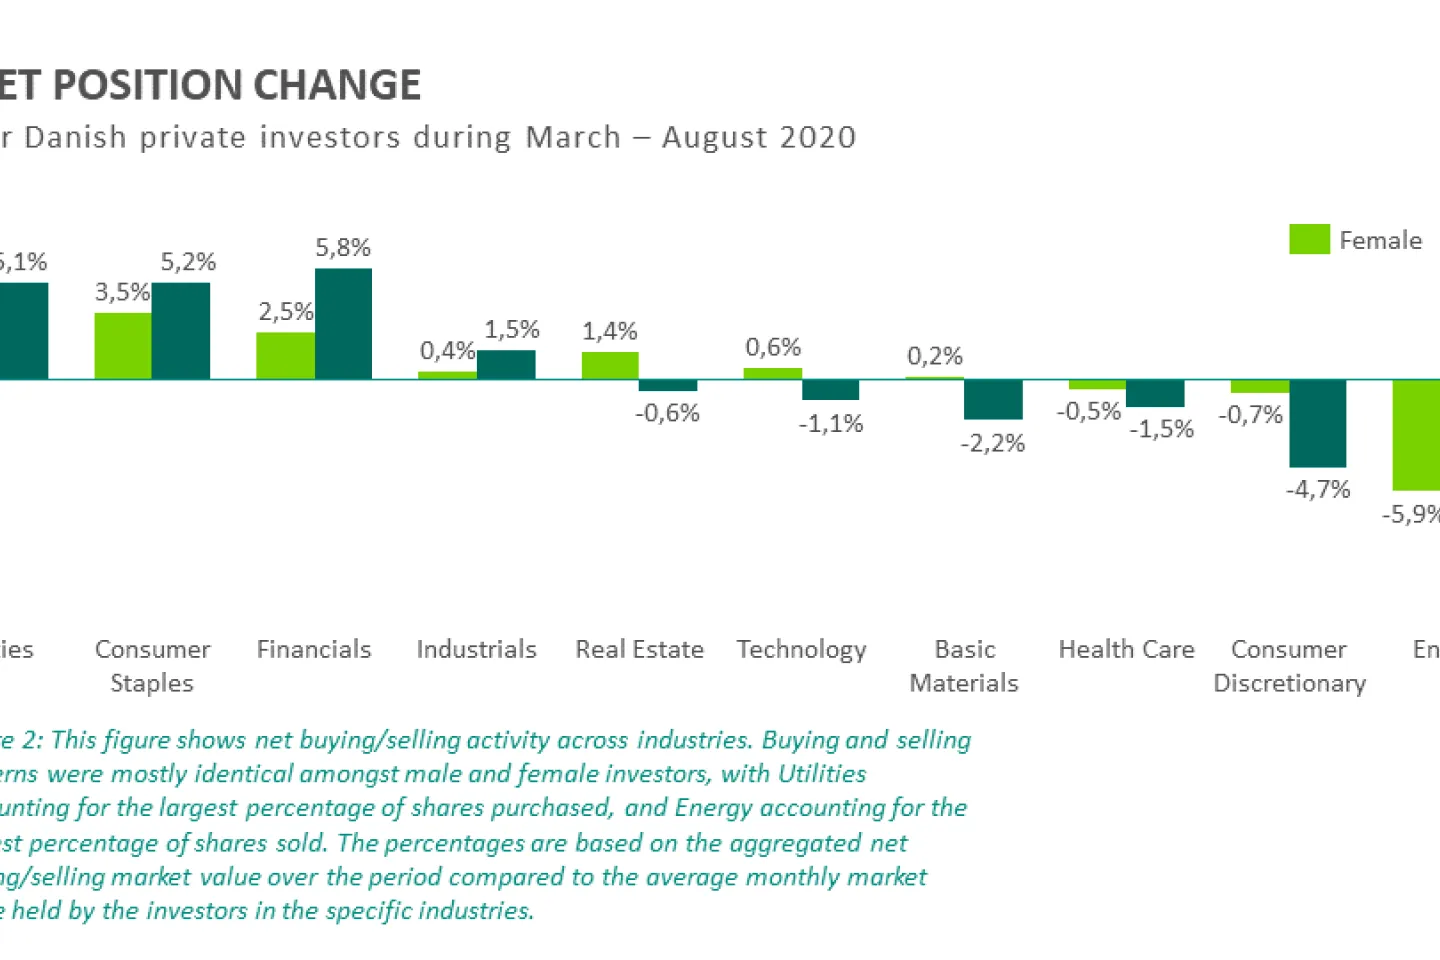
“The most popular industries during the period from March to August have been Utilities, such as Ørsted, Finance, which includes banks and insurance companies, and Consumer Staples,” Nino Ziino observes. “Utilities is the only industry with a monthly net buying activity during the entire six-month period, whereas Finance had a net buy in every month except July.”
Utilities also accounts for the largest increase amongst female investors, who have increased their holdings by 9%. For male investors, the financial sector constituted the largest increase, with investors purchasing what corresponds to 6% of their holdings, where the percentage refers to the average monthly market value held by investors in the specific industry.
Energy and Health Care popular divestments
“The industries with the most shares sold during this period include Energy, Consumer Discretionary, which includes companies like Matas and Tivoli, and Health Care,” Nino Ziino says. For all Danish private investors, the largest selling activity has been in the Energy sector, where female investors have sold for what corresponds to 6% of their holdings, and male investors have sold 11%. Again, the percentages refer to the average monthly market value held by the investors in the specific industry.
“In Health Care, the percentage-wise decrease (0.5% for female and 1.5% for male) is lower compared to Energy, for example. However, this is mainly due to the large volume investors hold, which is on average between 50-60% of the total equity holdings,” Nino Ziino explains. "Yet when you look at it in terms of absolute net selling, the Health Care sector has been the main net selling contributor from March to June, for both male and female investors.”
A more detailed breakdown of the trading activity can be seen in the graphs below:
Giving financial institutions insight into market trends
According to Bjørn Crepaz, Head of Issuer Products at VP, it’s these types of insights that make data such an interesting commodity for financial institutions. “Financial institutions typically only have their own picture of which industries and sectors interest private investors. At VP, however, we have a more complete overview of the Danish market distribution across a wide range of demographics, such as age and geography. This enables us to, for example, create customised benchmarks for these institutions, which might shed light on their market position and performance in relation to the overall investor landscape.”
To find out more about this and similar trend reports available to VP customers, contact Bjørn Crepaz.
Read also “Meeting our customers’ needs for trustworthy data” published earlier this year.
Notes:
- The terms “trade/trading” have been used in this article for simplicity. VP processes trade settlements, which correspond to the underlying trades. However, several trades might be “bundled” before VP receives them and hence some degree of detail might be lost. However, in the case of Danish private investors, this loss of detail is expected to play a rather insignificant role.
The term “trading activity” is defined as the average between the number of buying and selling settlement instructions processed at VP. - This analysis is based solely on Danish private investors, and only includes investments in shares registered within VP Securities. The primary focus of the analysis is shares traded on NASDAQ, as their categorisation forms the basis for the sector categories used in the analysis.