2022 was marked by superior and resilient market quality, even in times of volatility as demonstrated by our quantitative research studies, record trading days, and our core data centre migration to Italy, a major milestone for Euronext and the European trading landscape. We were also delighted to welcome a new member to our Cash and Derivatives team, Samantha Page, as Head of Market Structure, who is voicing Euronext’s views on MIFIR review debates.
Simon Gallagher, Head of Cash and Derivatives, Euronext Group
Highlights of 2022
- Equity volumes: Euronext is the largest exchange in Europe by Average Daily Value (ADV) traded for lit equities, with €10.5bn ADV in 2022 – representing over 25% of European lit continuous & auction trading.
- Data Centre migration: In June 2022, Euronext successfully completed the migration of its core Data Centre and related Colocation services from the UK to Italy in just 14 months – a first in Europe and globally – with no significant shifts in the liquidity landscape and in the trading behaviour of market participants.
- Market quality resiliency: During geopolitical turmoil in Q1 2022, Euronext maintained presence at EBBO of 66% on average – while presence at EBBO for MTFs was below 20%. Also back in 2020-2021, Euronext was more resilient than MTFs as we displayed 41% lower impact on spread and 2x higher Liquidity at Touch when volatility hit.
- Markouts analysis: Euronext published a quantitative research paper on passive posting across lit venues, demonstrating that Markouts at +1 second after passive trades are only +2.1 bps for Euronext – versus average Markouts of +2.6 bps for Aquis, +3.0 bps for Turquoise, and +3.1 bps for Cboe.
- Market Structure and Regulation: Samantha Page, appointed Head of Market Structure at Euronext, recently expressed her thoughts on the European Council's MiFIR Review-related press release of 20 December 2022.
-
What’s ahead in 2023: Borsa Italiana’s migration onto Euronext Optiq® is on track for its Phase 1 Go-Live on 27 March 2023, and from Q4 2023 Euronext will migrate Clearing services for all its markets* to its multi-asset clearing house Euronext Clearing.
*Excluding Oslo Børs cash markets
Equity volumes, trading peaks and most active stocks
Euronext Group is the largest exchange in Europe by Average Daily Value traded on lit equities (continuous & auctions), with €10.5bn ADV in 2022.
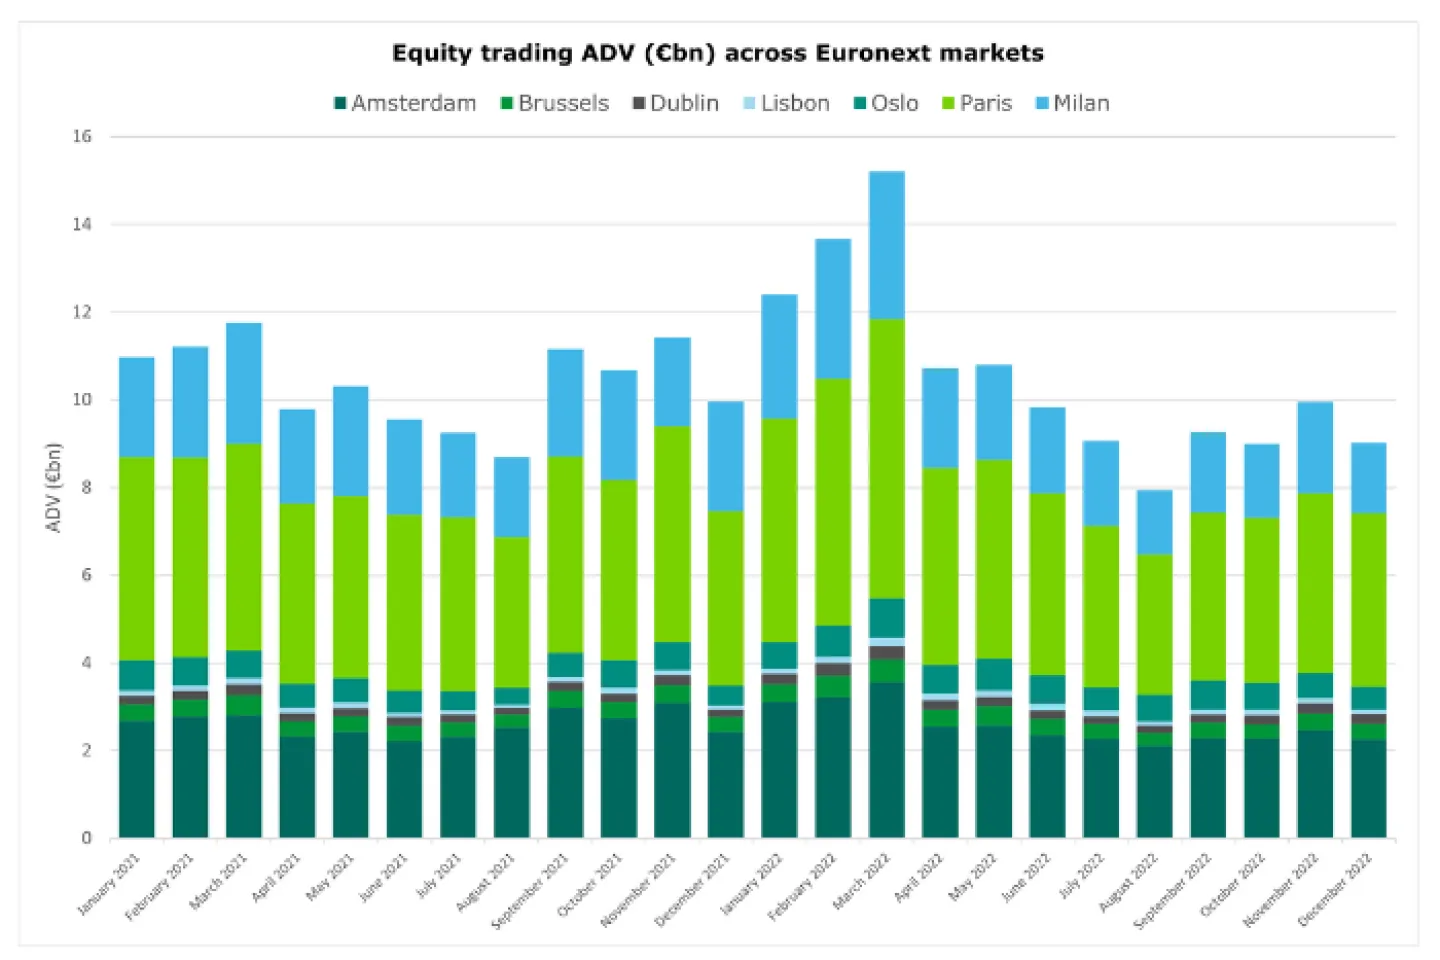
Data source: Euronext and IRESS Market Data, December 2022 (shares only)
Top 10 most active trading days in Europe
The first half of 2022 recorded high volumes due to geopolitical turmoil, while H2 was characterised by exceptional trading days driven mainly by option expiries, macroeconomic news and significant rebalancing of stock indices:
| Date | Pan-EU value traded on Euronext stock universe (€bn) |
Euronext market share (%) |
|---|---|---|
| 24 February 2022 | €35.71 | 67.2% |
| 7 March 2022 | €34.24 | 65.6% |
| 18 March 2022 | €34.11 | 81.7% |
| 16 December 2022 | €31.40 | 79.7% |
| 17 June 2022 | €31.09 | 80.3% |
Top 10 most traded stocks December 2022 (Euronext markets)
| ISIN | Name | Marketplace | Euronext value traded (€bn) in Dec-2022 |
|---|---|---|---|
| NL0010273215 | ASML HOLDING | Amsterdam | €8.14 |
| FR0000120271 | TOTALENERGIES | Paris | €8.08 |
| GB00BP6MXD84 | SHELL PLC | Amsterdam | €6.35 |
| FR0000121014 | LVMH | Paris | €5.18 |
| IT0005239360 | UNICREDIT | Milan | €3.40 |
| FR0000120578 | SANOFI | Paris | €3.31 |
| IT0000072618 | INTESA SANPAOLO | Milan | €3.18 |
| NL0011821202 | ING GROEP N.V. | Amsterdam | €3.01 |
| IT0003132476 | ENI | Milan | €2.96 |
| FR0000131104 | BNP PARIBAS | Paris | €2.86 |
Data source: Euronext Group and IRESS Market Data. Market share figures refer to lit continuous and auctions share of trading compared to the main European MTFs.
Don’t forget:
Euronext, like other regulated exchanges, offers pools of liquidity for a wide variety of Small & Medium Enterprises.
As an example, approximately 60% of mid & small cap companies listed on Euronext (with market cap < €250m) cannot be traded on European MTFs.
Successful Core Data Centre migration
In June 2022, Euronext successfully completed the migration of its Core Data Centre and related Colocation services from Basildon, UK, to the Aruba Global Cloud Data Centre IT3 in Bergamo, Italy, a state-of-the-art data centre facility powered by green energy.
The data centre move was completed in just 14 months, with a smooth migration process for market participants and no significant shifts in the liquidity landscape or the trading behaviour of direct members.
EBBO Regain time: How long does it take for MTFs to reach the EBBO set on Euronext (or vice versa)?
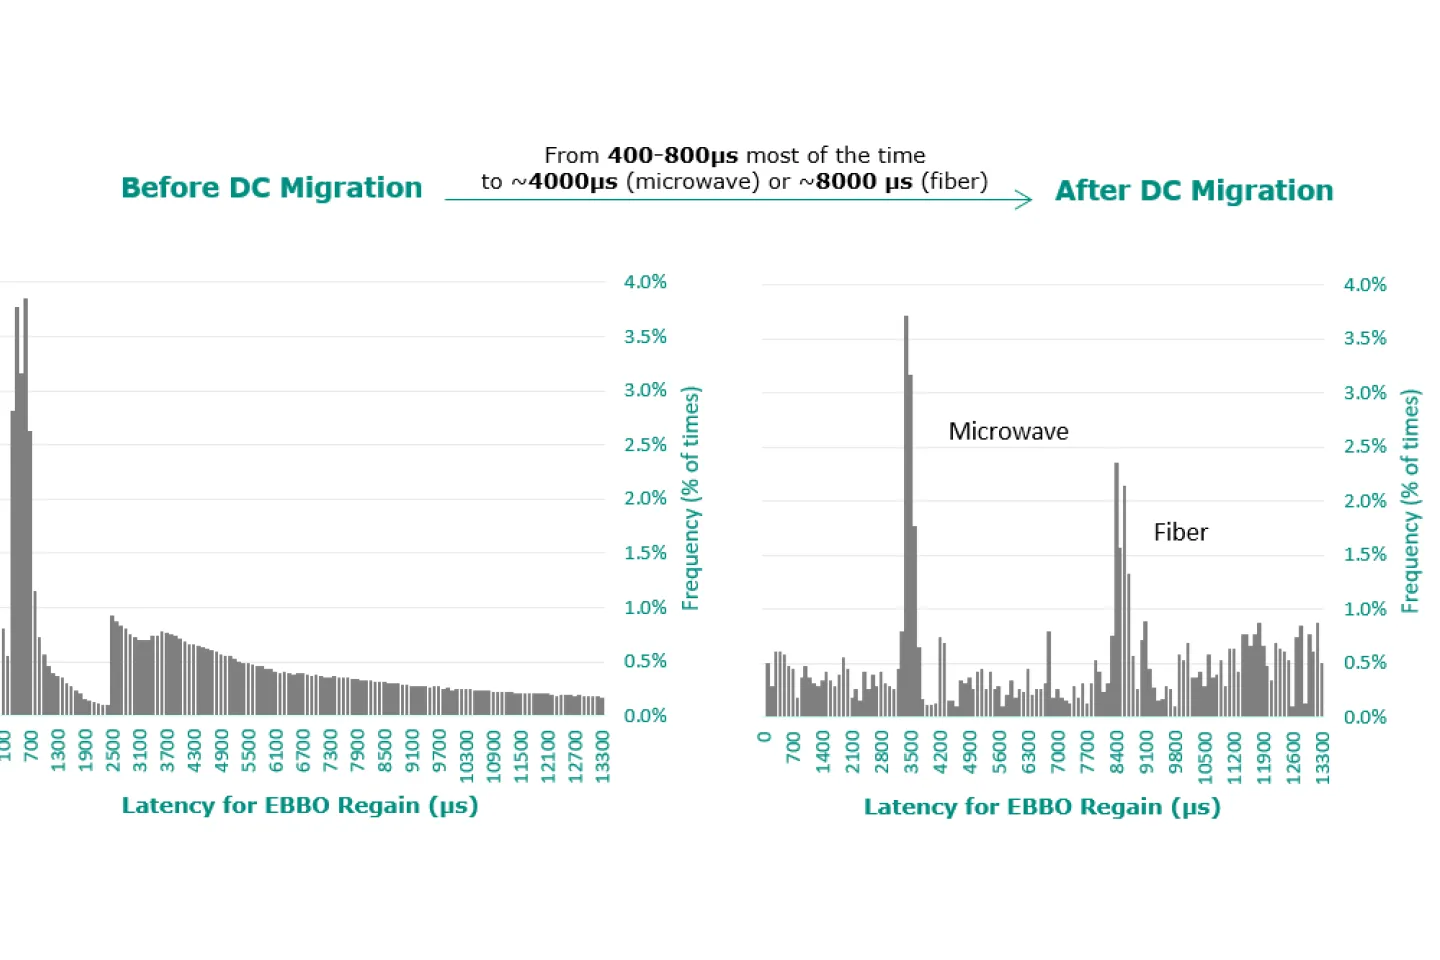
Data source: big xyt, ‘EBBO Regain’ dashboard for Euronext and Cboe Europe
Despite 10-20x increase in latency “distance” from London-based MTFs, average spreads for blue chips on Euronext were consistently lower compared to alternative venues even after our Data Centre migration, and Liquidity at Touch was above €22k on Euronext.
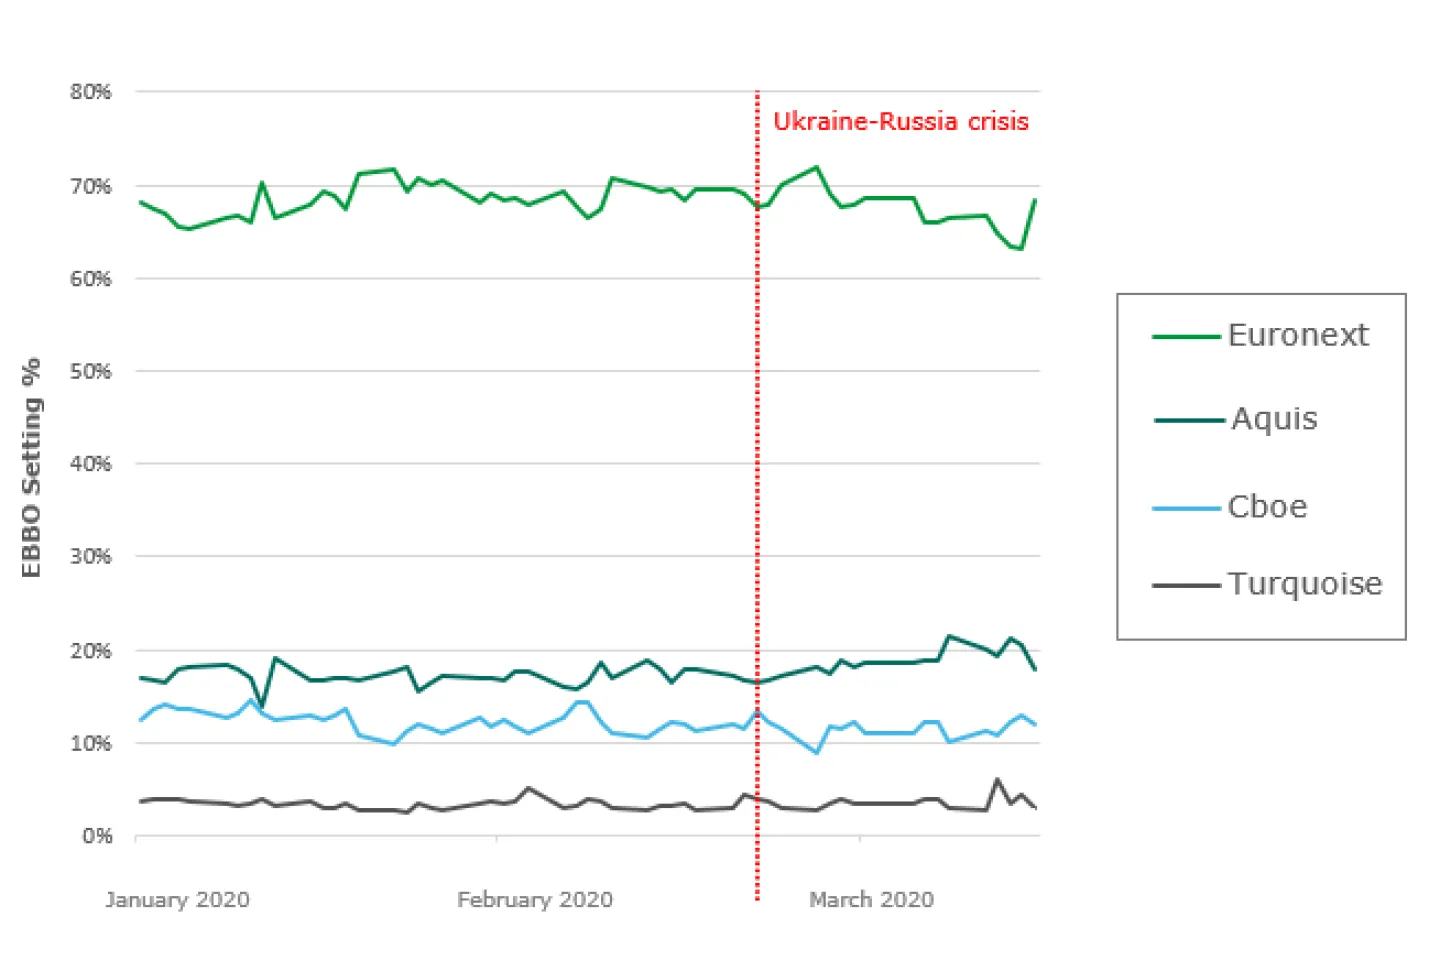
Market quality resiliency during volatile periods
Since March 2020 when the Covid pandemic hit, and again in 2022-Q1 with the Ukraine-Russia crisis, levels of volatility were exceptionally high. Although the nature of the two periods was different, equity markets proved to be more resilient to distortions in 2022 compared to the first Covid wave in 2020.
The percentage of time that venues set the best prices has been rather stable even when the crisis started: Euronext EBBO Setting leading at 66% while the main European MTFs were all below 20%.
| Euronext | Aquis | Cboe | Turquoise | |
|---|---|---|---|---|
| Average EBBO Setting Post-Crisis |
66% | 19% | 12% | 4% |
Data source: BMLL Technologies
Data for CAC 40® constituents from 3 January to 31 March 2022
|
In May 2022, we published a market quality analysis showing that – despite the global geopolitical turmoil – Euronext maintained stronger metrics than MTFs in terms of average spreads, EBBO Presence and EBBO Setting. And before that, in December 2021, our first market quality study had proved that during Covid pandemic waves, the impact on spreads had been 41% smaller on Euronext compared to MTFs, and the Liquidity at Touch was 2x larger. |
Lower Markouts for passive posting at Euronext
In June 2022, Euronext’s Quantitative Research team performed an analysis of Markouts across lit trading venues, in order to compare elementary market impact following passive trades.
The research paper by Paul Besson and his team – based on third party and replicable data – displayed that Markouts at 1 second after the trade are only +2.1 bps for Euronext, versus Markouts of +2.6 bps for Aquis, +3.0 bps for Turquoise, +3.1 bps for Cboe.
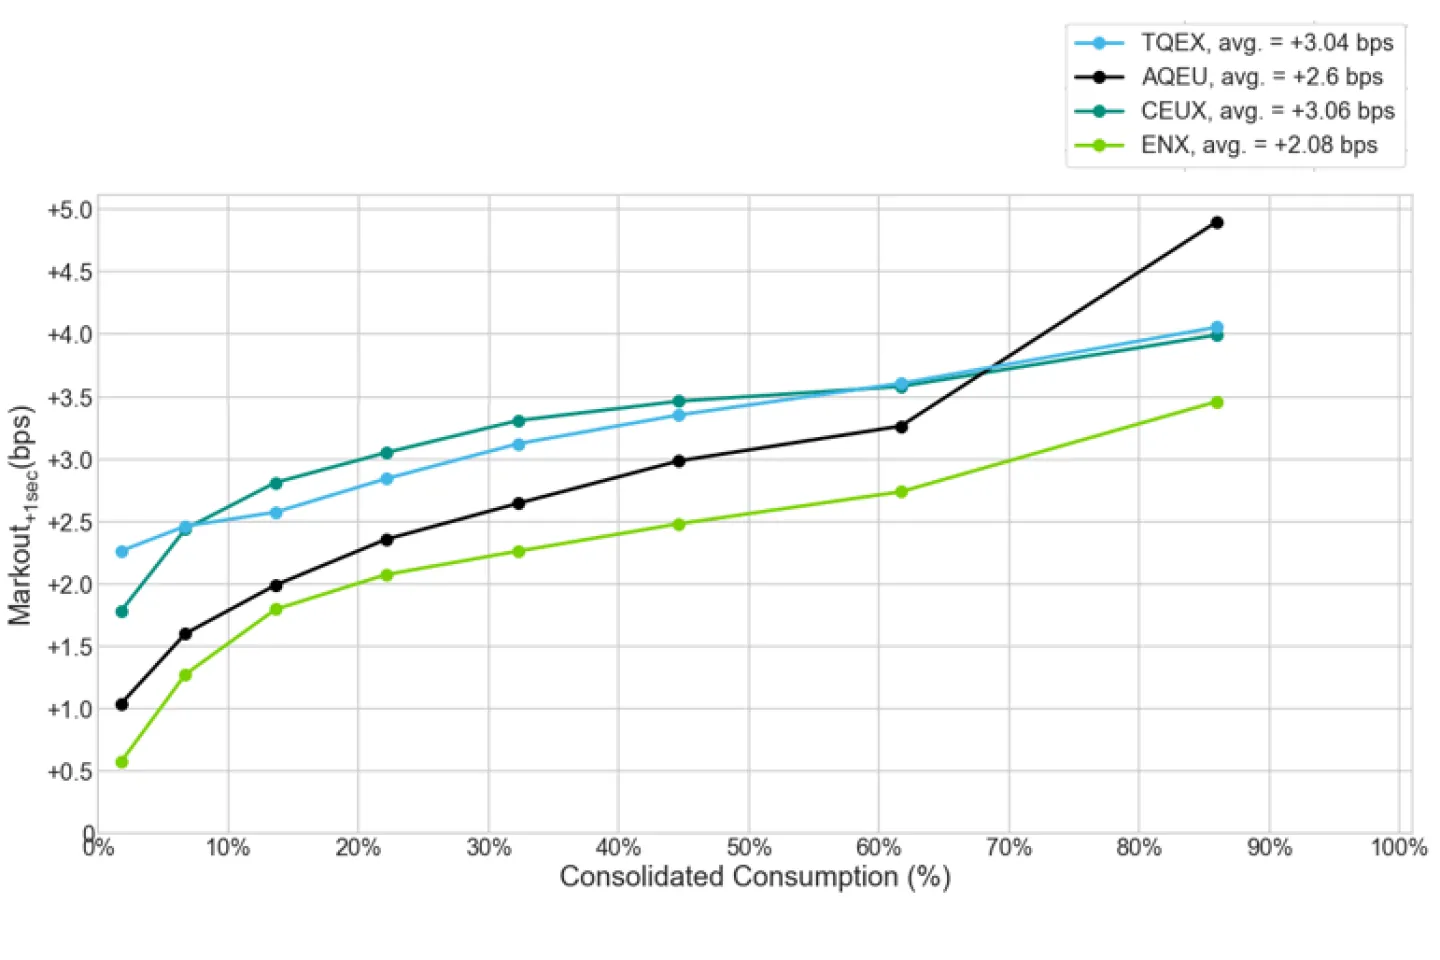
Data source: IRESS Market Data
Research paper “Better passive posting across Lit venues based on quantitative analysis of Markouts”: analysis based on 116 stocks across top 5 indices in Belgium, France, the Netherlands – from February to June 2022.
Market Structure and Regulatory update

Samantha Page, appointed in October 2022 as Euronext Head of Market Structure, highlighted in a LinkedIn article this month the need for more in-depth discussion around market structure as the MiFIR Review debate continues, notably following the Council’s press release on 20 December.
While the Commission’s stated aim is “improving transparency and availability of market data, improving the level-playing field between execution venues and ensuring that EU market infrastructures can remain competitive at international level”, the Council text does not, unfortunately, deliver on this in many of the key areas.
- The proposal of a single volume cap at 10% and the removal of the negotiated trade waiver (NTW) from the cap will result in more trading under reference price waiver (RPW): not an improvement in transparency.
- The Council text no longer includes the Commission proposal to limit the use of the RPW by any size threshold, which instead would have prevented small retail trades being executed in the dark.
The Council mandate seems to remove the minimum quoting obligations for Systematic Internalisers, creating more flexibility for SIs by allowing midpoint matching: it prevents investors from participating in potential price improvements.
“In our view, the cumulative effect from these changes will reduce transparency and encourage more bilateral trading, impairing the price formation process and damaging market quality, by fragmenting liquidity, increasing operational risk and increasing market search costs, all to the detriment of end investors. Surely this was not - and should not be - the intended outcome of the review of MiFIR?"
What's ahead in 2023...
Borsa Italiana Cash and Derivatives markets will join the Euronext single order book powered by Euronext’s Optiq® trading platform: Phase 1 Go-Live is on track and scheduled on 27 March 2023.
On the Post-Trade side, from Q4 2023, Euronext will migrate clearing services for all its markets* to its own multi-asset clearing house Euronext Clearing, while its four Central Securities Depositories have been combined into Euronext Securities.
*Excluding Oslo Børs cash markets
Did you know that...
In early 2022, Euronext agreed to be among the founding members of the Sustainable Trading Initiative – initiated by Duncan Higgins in order to foster ESG discussions in the secondary trading space among buy-side, sell-side, trading venues and tech firms.
Euronext Equities team at events in 2023
- AFME Equities Dinner
9 March, London - FIX EMEA
9 March, London - FIA Forum
9 March, Stockholm - TradeTech Europe
17-19 April, Paris - International TraderForum
6-8 September, Barcelona
Check out our latest news on LinkedIn
Click on the links below:
Over 1,900 stocks and 25% of EU lit equity value traded
Market quality: Euronext spreads and liquidity at touch vs MTFs
Market quality: Euronext EBBO prices and setting vs MTFs
What should be addressed in MiFIR Review
For more information

Do not hesitate to share with your sales representatives
any feedback or question that you might have.
Thank you!
This publication is for information purposes only and is not a recommendation to engage in investment activities. This publication is provided "as is" without representation or warranty of any kind. Whilst all reasonable care has been taken to ensure the accuracy of the content, Euronext does not guarantee its accuracy or completeness. Euronext will not be held liable for any loss or damages of any nature ensuing from using, trusting or acting on information provided. No information set out or referred to in this publication shall form the basis of any contract. The creation of rights and obligations in respect of financial products that are traded on the exchanges operated by Euronext's subsidiaries shall depend solely on the applicable rules of the market operator. All proprietary rights and interest in or connected with this publication shall vest in Euronext. No part of it may be redistributed or reproduced in any form without the prior written permission of Euronext.
Euronext refers to Euronext N.V. and its affiliates. Information regarding trademarks and intellectual property rights of Euronext is located at www.euronext.com/terms-use.
© 2023, Euronext N.V. - All rights reserved.
Euronext NV | Beursplein 5, 1012 JW Amsterdam