Market quality analysis on Euronext remaining the venue for price formation in Europe.
We provide observations on Euronext’s superior price formation metrics compared to MTFs, with a focus on volumes and market quality during volatile weeks in March, and resiliency following the migration of Milan markets to Euronext’s Optiq technology platform.
Simon Gallagher, Head of Cash and Derivatives, Euronext
Highlights
-
Euronext Group volumes increased with recent volatility since mid-March:
-
Euronext Group Average Daily Value (ADV) traded increased by +43% up to €14.4bn during the period of 10 to 24 March.
-
€27.6bn was traded on Euronext equity markets on Friday 17 March, the third-highest historical record of volumes for the Group.
-
-
Euronext is by far the venue for price formation for Paris-listed stocks, even more significantly when volatility hits:
-
EBBO Setting on Euronext improved during mid-March volatility, from 61.7% to 68.5%, now 4-6x times higher than Cboe and Aquis.
-
Even when volatility normalised, EBBO Setting on Euronext remained +2.4% points higher than pre-volatility levels.
-
-
Euronext market quality for Milan-listed stocks improved with the recent volatility spikes, and even further after the migration to Euronext’s Optiq platform:
-
EBBO Setting climbed for Euronext from 49.1% before volatility spikes, to over 52% during March volatility, and then further to 57% since the Optiq migration. It is now 3.5x higher than Cboe and 2x higher than Aquis.
-
EBBO Presence: Euronext is now leading with 75.2% time Presence at EBBO, +10% points above MTFs.
-
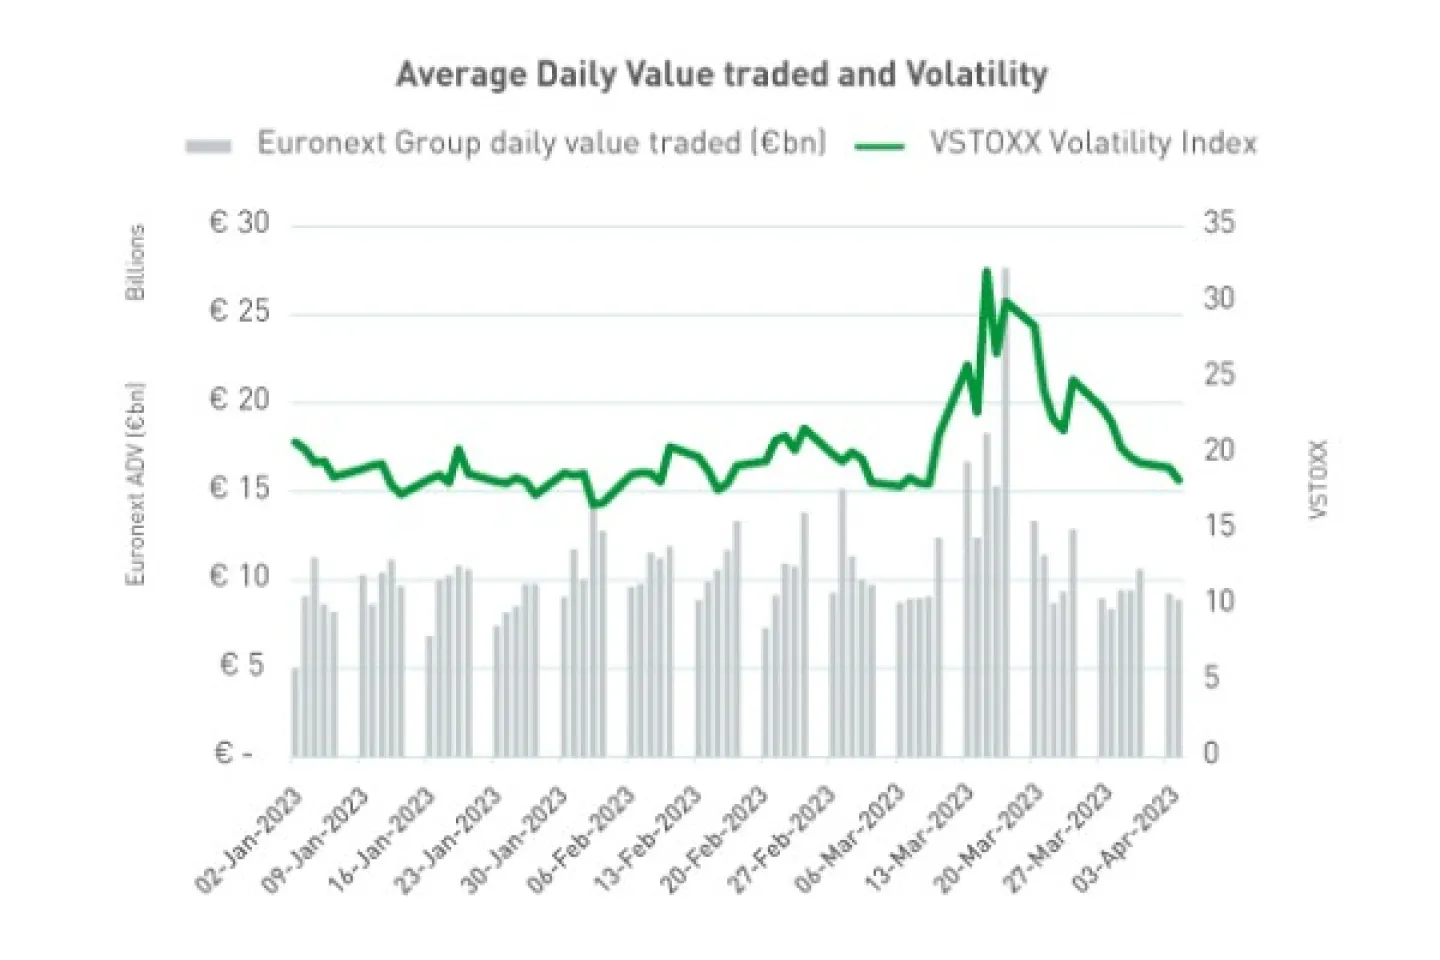
Equity volumes and volatility
- In 2023, before the volatility spikes of mid-March, Euronext Group Average Daily Value (ADV) traded was €10.1bn.
- With the volatility uptick from 10 March 2023, Euronext Group turnover increased by +43% to €14.4bn Average Daily Value (ADV) traded.
- €27.6bn was traded on Euronext markets on Friday 17 March, marking the third-highest historical record for the Group.
| Euronext Group ADV traded (€bm) |
VSTOXX Volatility Index |
|
|---|---|---|
| Pre Volatility 2 January – 9 March 2023 |
€10.1 bn | 18.9 |
| During Volatility 10 – 24 March 2023 |
€14.4 bn | 25.4 |
| DELTA vs Pre Volatility |
+43% | +6.5 |
Data source: Euronext Group. Volumes include Central Order Book and reported deals.
Market quality during volatile weeks of March - Paris
Euronext is the venue for price formation for Paris-listed stocks, even more significantly when volatility hits:
- EBBO Setting on Euronext improved during mid-March volatility, from 61.7% to 68.5%, becoming 4x higher than Cboe and 6x higher than Aquis.
- Even when volatility normalised towards end of March, EBBO Setting on Euronext remained +2.4% points higher than pre-volatility levels.
| EBBO Setting (%) | Euronext | Cboe | Aquis | Turquoise |
|---|---|---|---|---|
| Pre Volatility 2 January – 9 March 2023 |
61.7 | 18.8 | 13.2 | 5.7 |
| During Volatility 10 – 24 March 2023 |
68.5 | 15.4 | 11.6 | 4.1 |
| DELTA vs Pre Volatility |
+6.8 | -3.3 | -1.6 | -1.7 |
| Post Volatility 25 March – 3 April 2023 |
64.1 | 17.8 | 11.9 | 4.8 |
| DELTA vs Pre Volatility |
+2.4 | -1.0 | -1.3 | -0.9 |
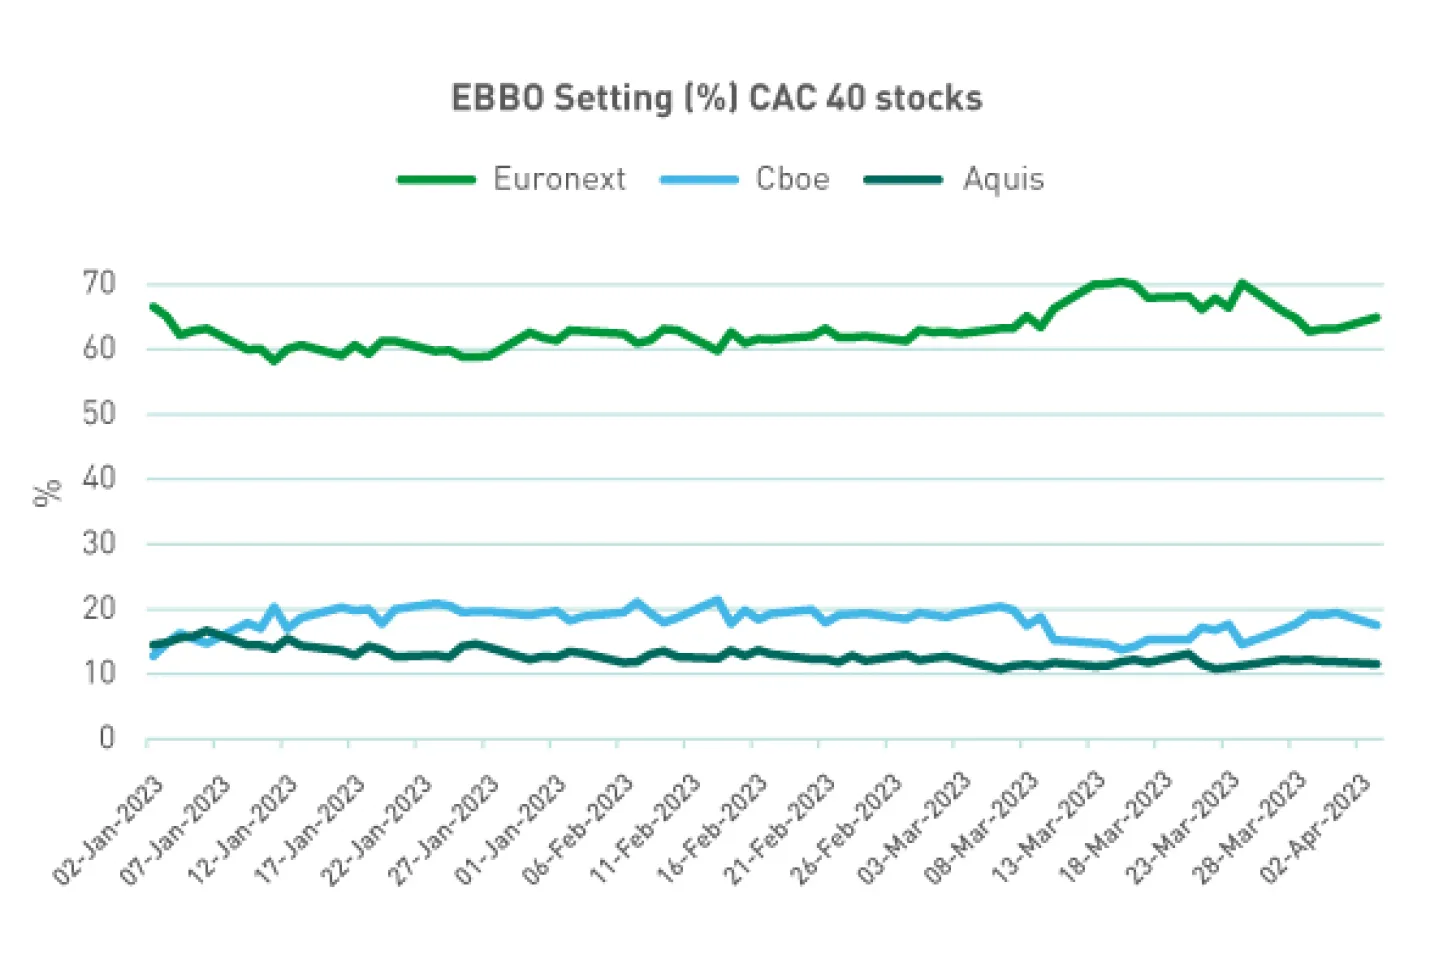
Data source: BMLL Technologies
Such observations are consistent with market quality resiliency of Euronext in volatile periods over the last three years, as we have demonstrated with dedicated studies:
• Equity market quality in times of volatility | December 2021
Despite the volatility shock due to Covid waves in 2020 and 2021, Euronext displayed better Spreads, Liquidity at Touch and EBBO metrics compared to MTFs.
• Is the Equity market more resilient to global turmoil? | April 2022
European market quality was even more resilient during the Ukraine-Russia crisis in early 2022 than during the Covid waves in 2020. With volatility spikes during geopolitical tensions, Euronext maintained better EBBO Presence and Setting than MTFs.
Market quality following the migration to Optiq - Milan
Market quality and resiliency: Euronext market quality for Milan-listed stocks has been resilient to the recent volatility spikes and has improved sharply since the Optiq migration:
- EBBO Setting climbed for Euronext from 49.1% before volatility spikes, to over 52% during volatility peaks.
- EBBO Setting on Euronext increased to 57% since the Optiq migration. It is now 3.5x higher than Cboe and 2x higher than Aquis.
| EBBO Setting (%) | Euronext | Cboe | Aquis | Turquoise |
|---|---|---|---|---|
| Pre Volatility 2 January – 9 March 2023 |
49.1 | 18.7 | 29.5 | 2.7 |
| During Volatility 10 – 24 March |
52.1 | 17.6 | 27.8 | 2.5 |
| DELTA vs Pre Volatility |
+3.1 | -1.2 | -1.7 | -0.2 |
| Post Volatility 25 March – 3 April 2023 |
57.0 | 15.5 | 26.1 | 1.8 |
| DELTA vs Pre Volatility |
+8.0 | -3.2 | -3.3 | -0.9 |
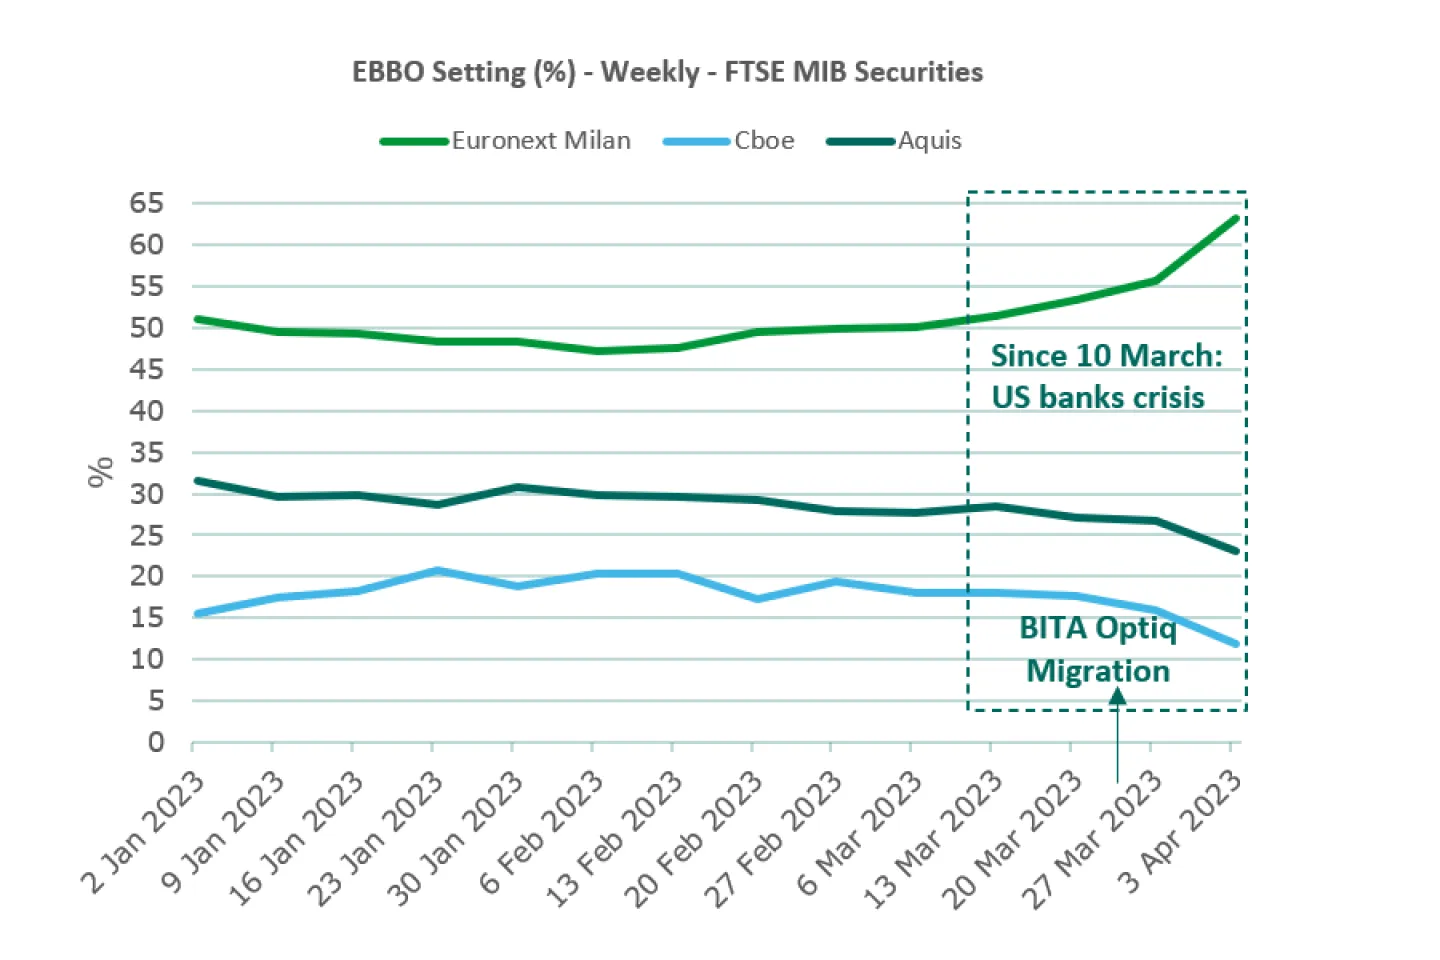
Data source: BMLL Technologies
For more information

Do not hesitate to share with your sales representatives
any feedback or question that you might have.
Thank you!
This publication is for information purposes only and is not a recommendation to engage in investment activities. This publication is provided "as is" without representation or warranty of any kind. Whilst all reasonable care has been taken to ensure the accuracy of the content, Euronext does not guarantee its accuracy or completeness. Euronext will not be held liable for any loss or damages of any nature ensuing from using, trusting or acting on information provided. No information set out or referred to in this publication shall form the basis of any contract. The creation of rights and obligations in respect of financial products that are traded on the exchanges operated by Euronext's subsidiaries shall depend solely on the applicable rules of the market operator. All proprietary rights and interest in or connected with this publication shall vest in Euronext. No part of it may be redistributed or reproduced in any form without the prior written permission of Euronext.
Euronext refers to Euronext N.V. and its affiliates. Information regarding trademarks and intellectual property rights of Euronext is located at www.euronext.com/terms-use.
© 2023, Euronext N.V. - All rights reserved.
Euronext NV | Beursplein 5, 1012 JW Amsterdam